Viam TeleOperation
Remote sensor visibility and control in real time
TEAM
1 Project Owner
1 Designer
1 Technical Program Manager
4 Developers
MY ROLES
Strategy
Competitive Research
Experience Design
User Research
Visual Design
PROJECT TIMELINE
Sep 2024 – Oct 2024
Overview
Many companies lack real-time visibility into their machines due to fragmented systems, outdated hardware, and inconsistent data standards. These gaps make it difficult to detect issues early, integrate insights, or respond quickly, especially in remote or infrastructure-poor environments.
Problem
While Viam could collect data from a wide range of input sources and expose it through the UI and exports, the information was fragmented and difficult for users to interpret or act on effectively.
Goals
👁️ Enable real-time visibility into robot sensor states
↔️ Support bi-directional control for developers and operators
📶 Standardize telemetry UI for machine health
🛠️ Reduce tooling fatigue by consolidating multiple dashboards
Process
Research & Discovery
I conducted interviews with internal stakeholders (product, engineering, support) and shadowed solutions engineers during real machine dashboard setup. I also benchmarked tooling from competitors like Arduino and Datadog. These efforts revealed a common theme: while the platform surfaced vast amounts of sensor data, users lacked the context or structure to interpret it confidently. Developers wanted tools that felt native to their workflow, familiar layouts, responsive controls, and streamlined diagnostics.
Competitive Analysis
Arduino
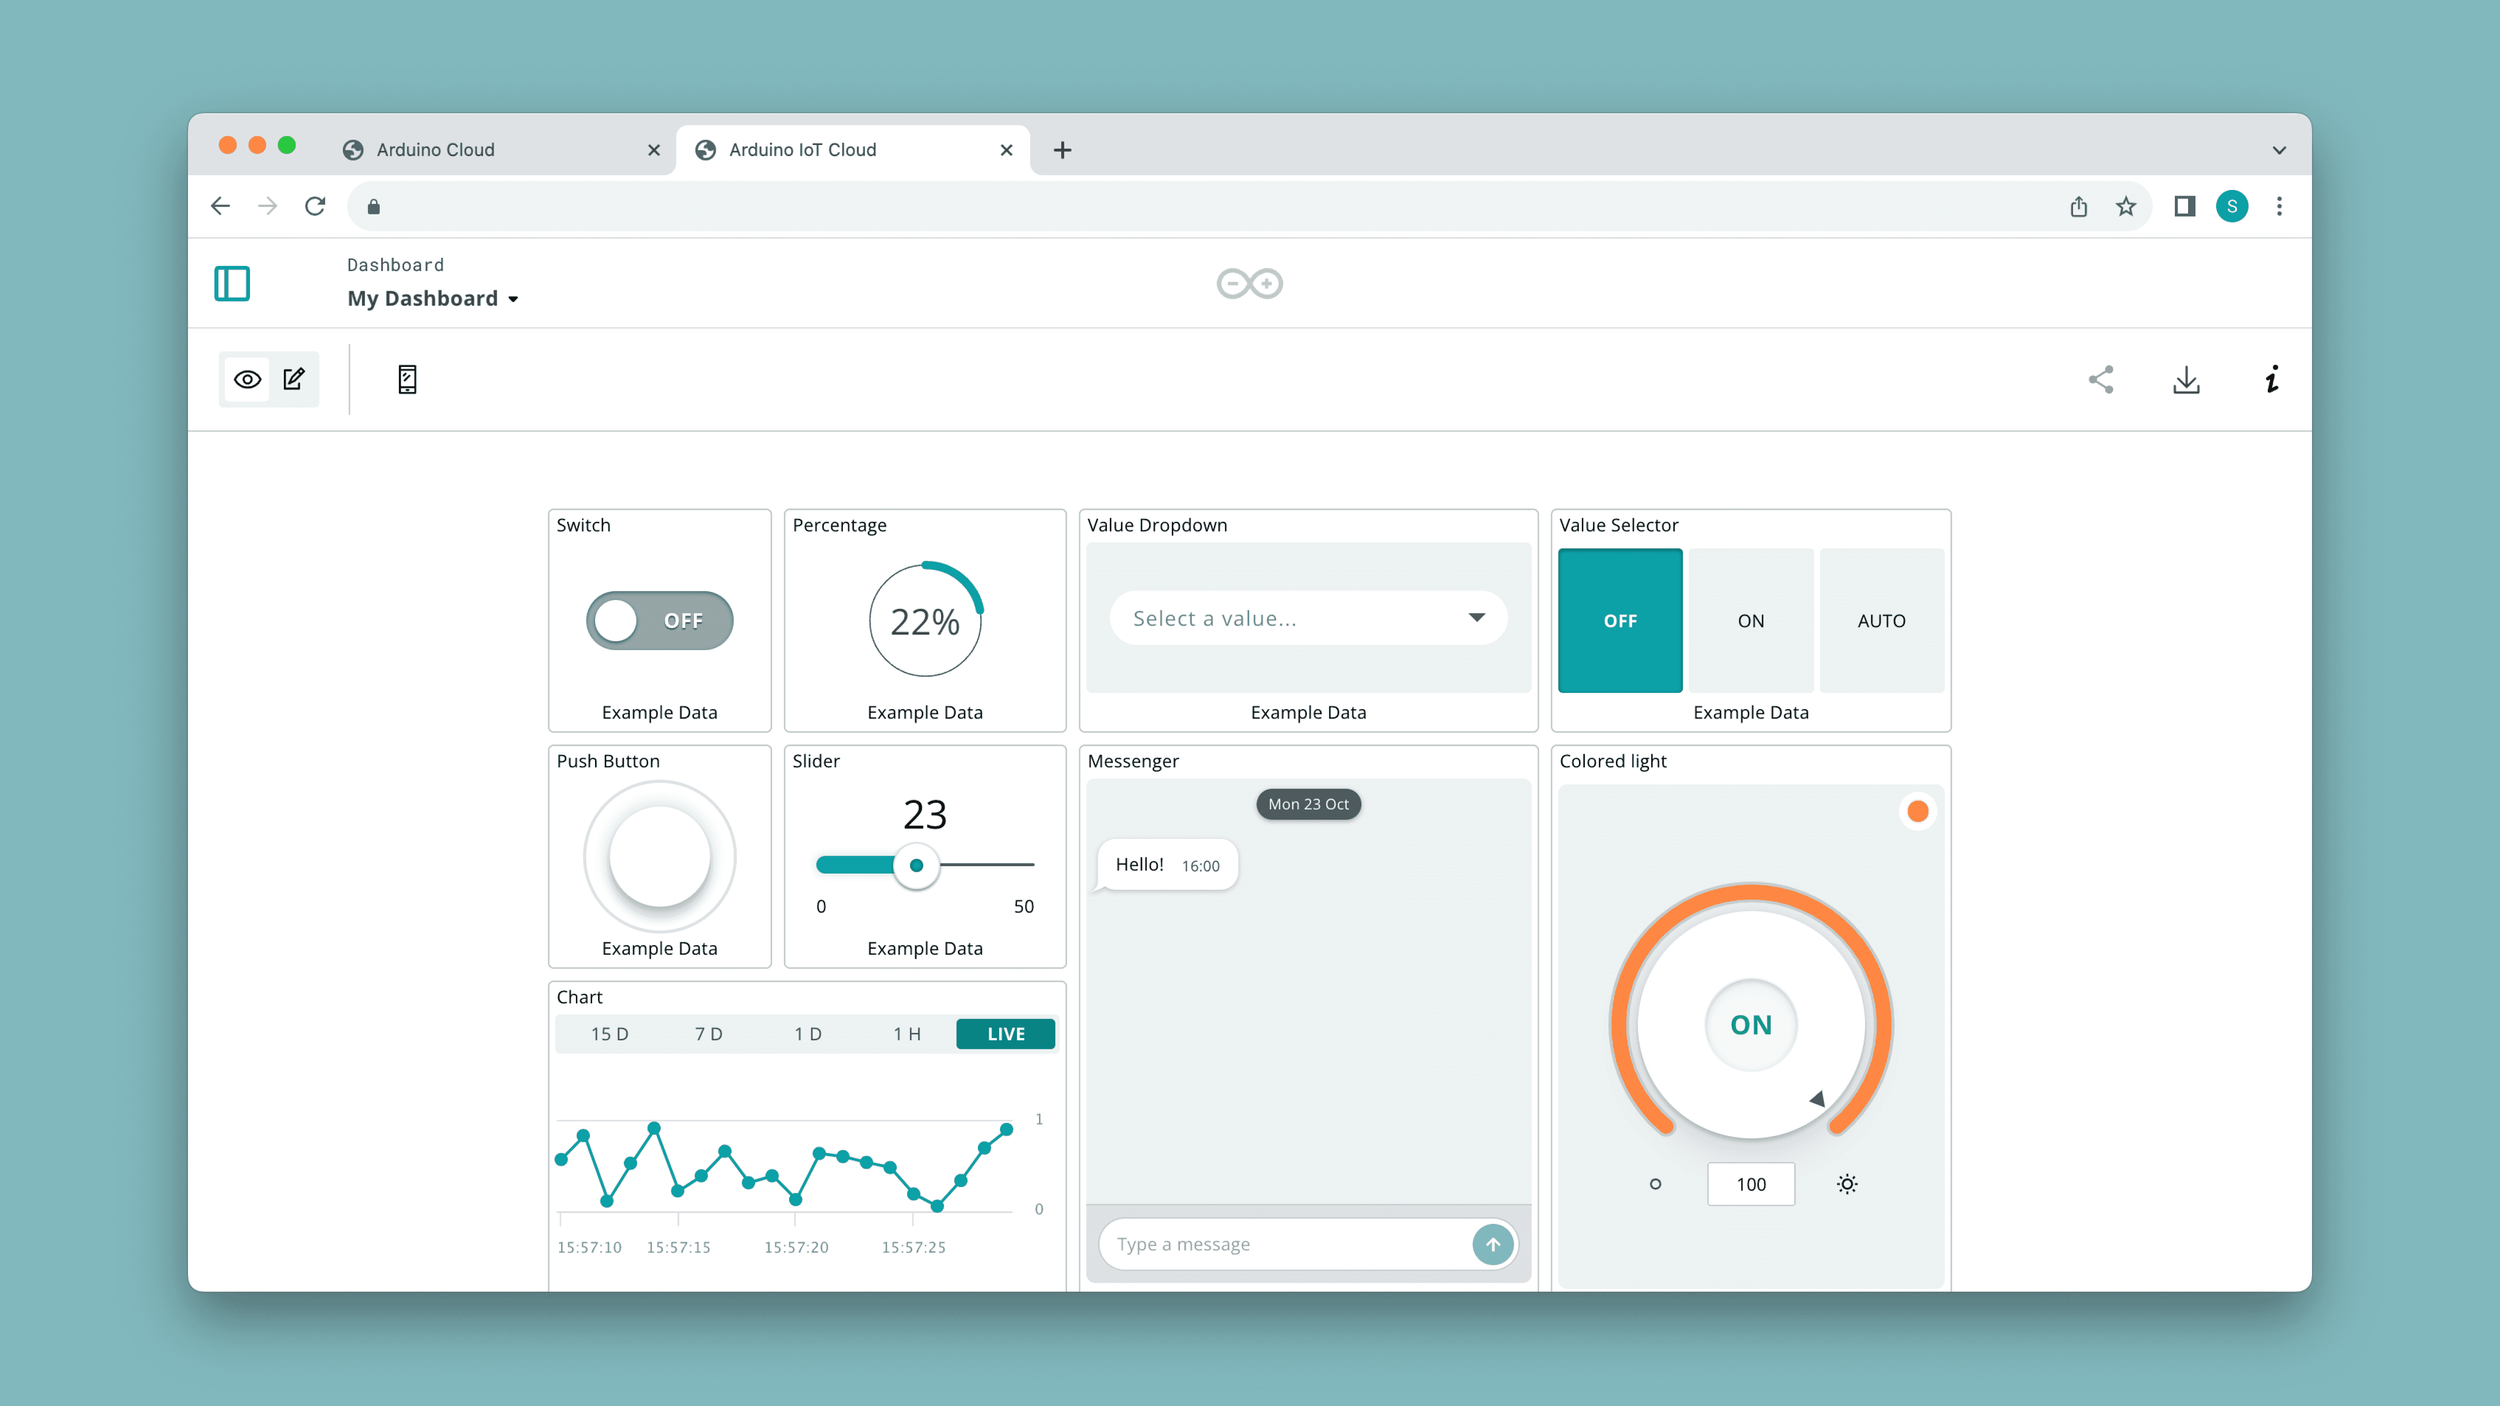
Arduino IoT dashboard: Device-centric, but not built for robotic sensor workflows.
Datadog
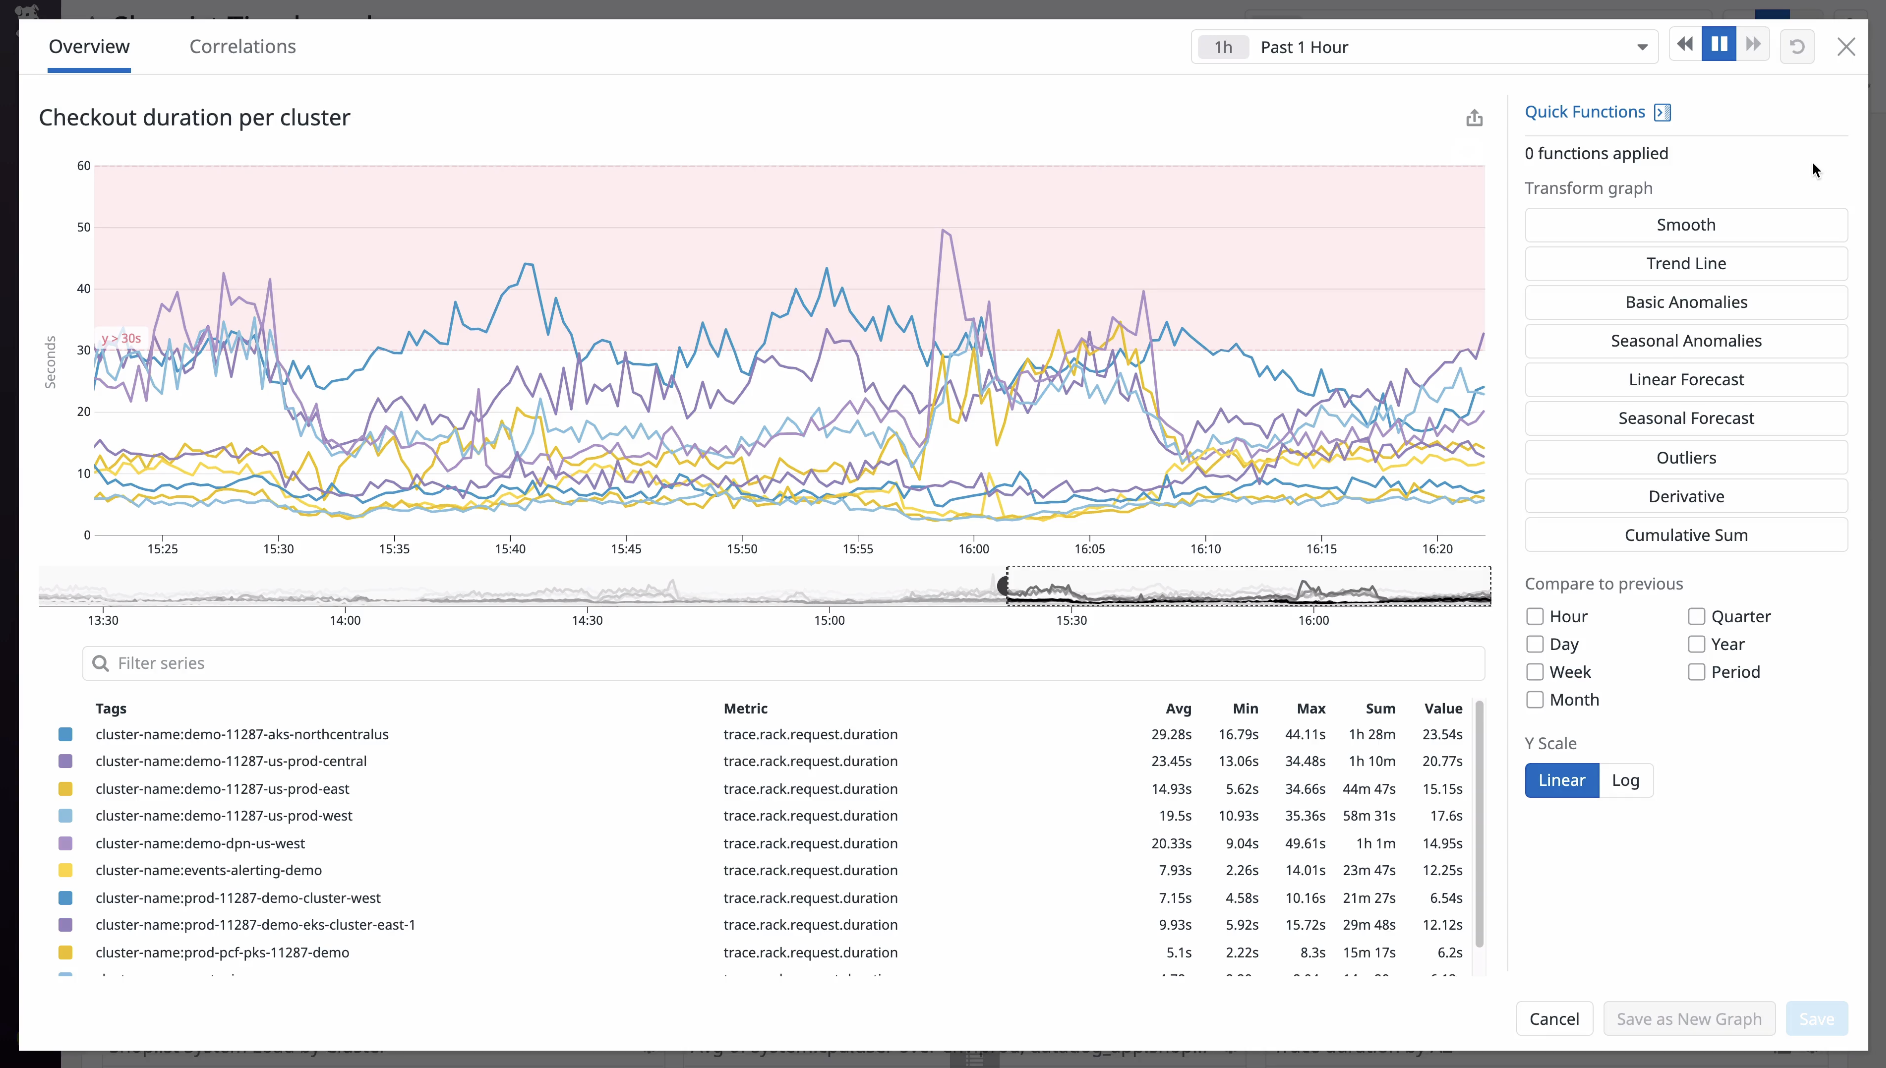
Datadog: Excellent for server observability, less intuitive for machine telemetry.
Key Insights
📈 Sensor data was available, but not actionable
Users were overwhelmed by raw data streams and needed a way to correlate sensor states with system behavior.
🧩 Tooling fatigue was real
Many users jumped between multiple dashboards, logs, and command-line tools. They wanted a unified environment.
🧠 Familiar patterns helped adoption
Using standardized visualization components reduced ramp-up time and made TeleOp feel “native” to their workflow.
Design Approach
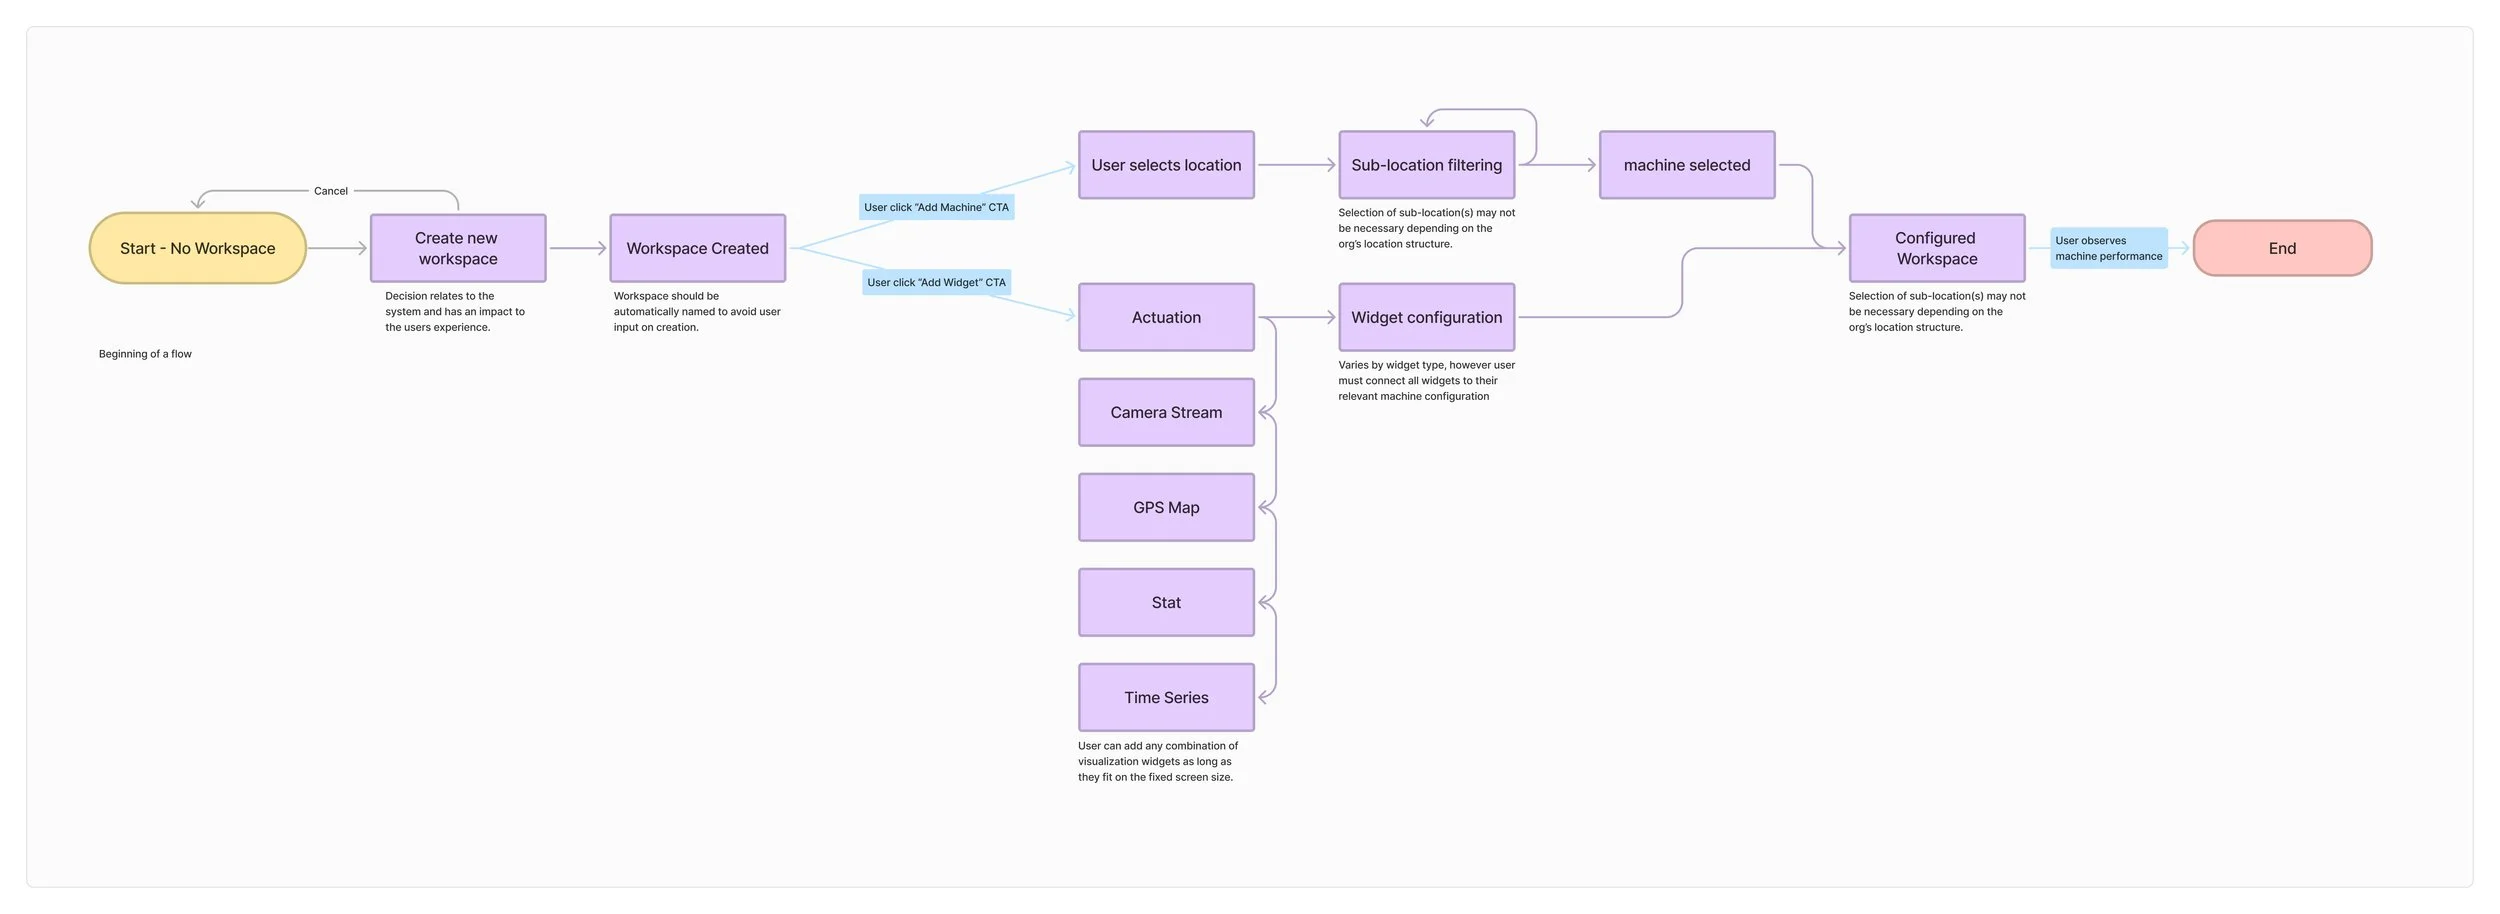
Flow Map
I mapped out the core user journeys for different personas, including solutions engineers and developers. Early flows prioritized quick access to machine status, streamlined manual control interactions, and fallback paths for degraded network environments.
Wireframes
Low-fidelity wireframes tested different structural models: tabbed dashboards, collapsible sensor panels, and split-view layouts combining control and telemetry. Wireframes helped validate navigation hierarchy and the balance between overview and detail views.
Iterations
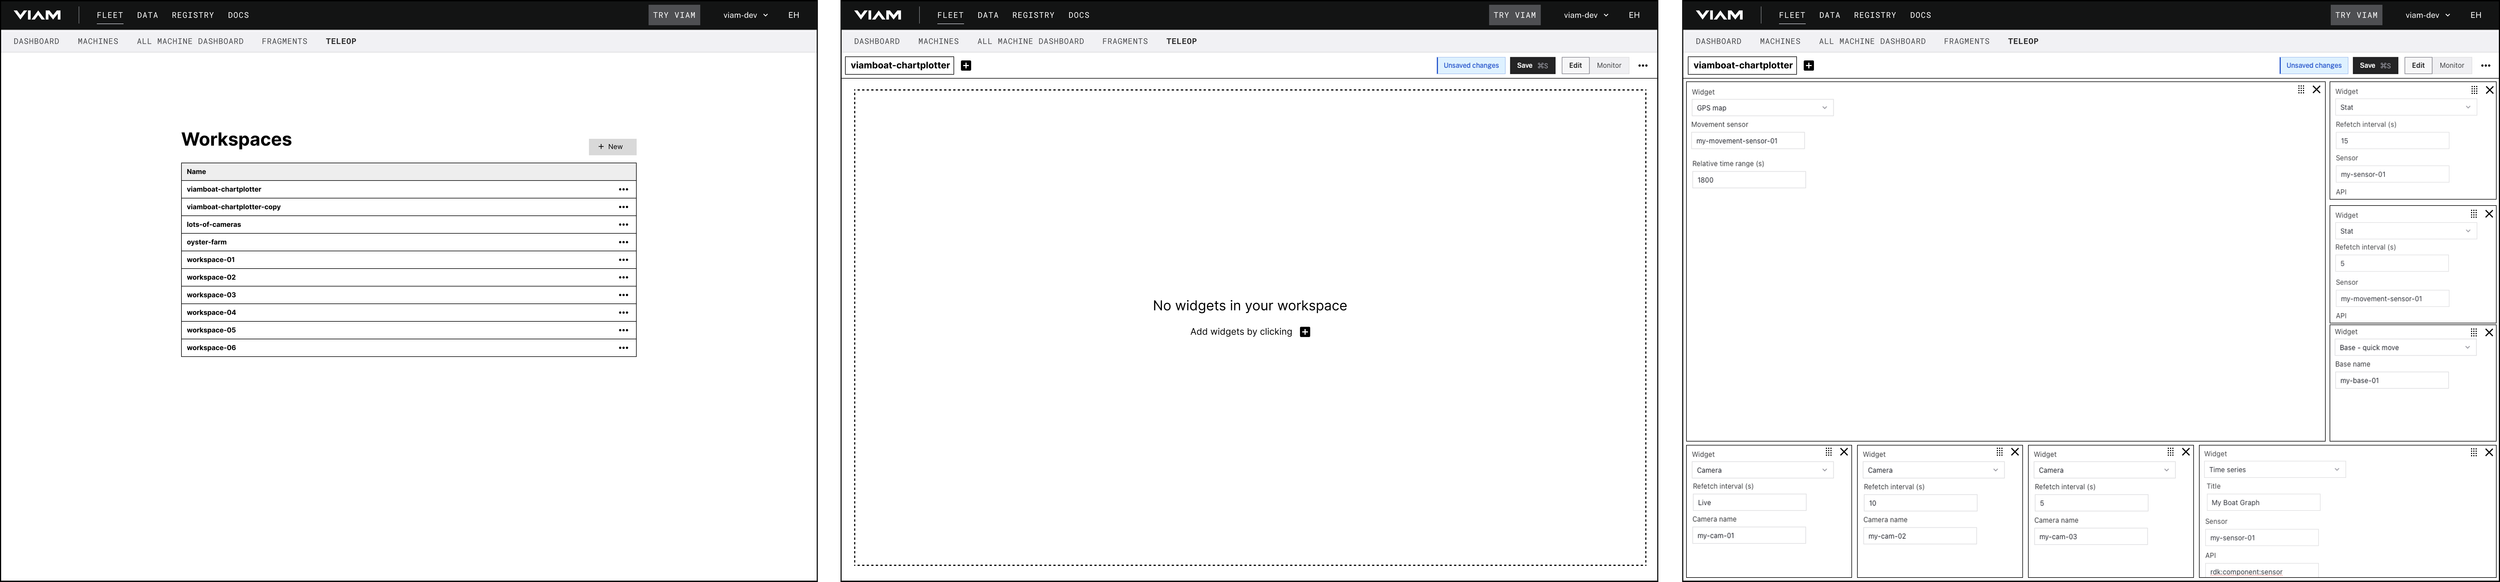
Through rounds of feedback and internal testing, we refined the UI to prioritize actionability, revising the UI to allow users to configure widget using a sidebar instead of directly on the cards. This allows users to view their configurations in a clear and consistent way.
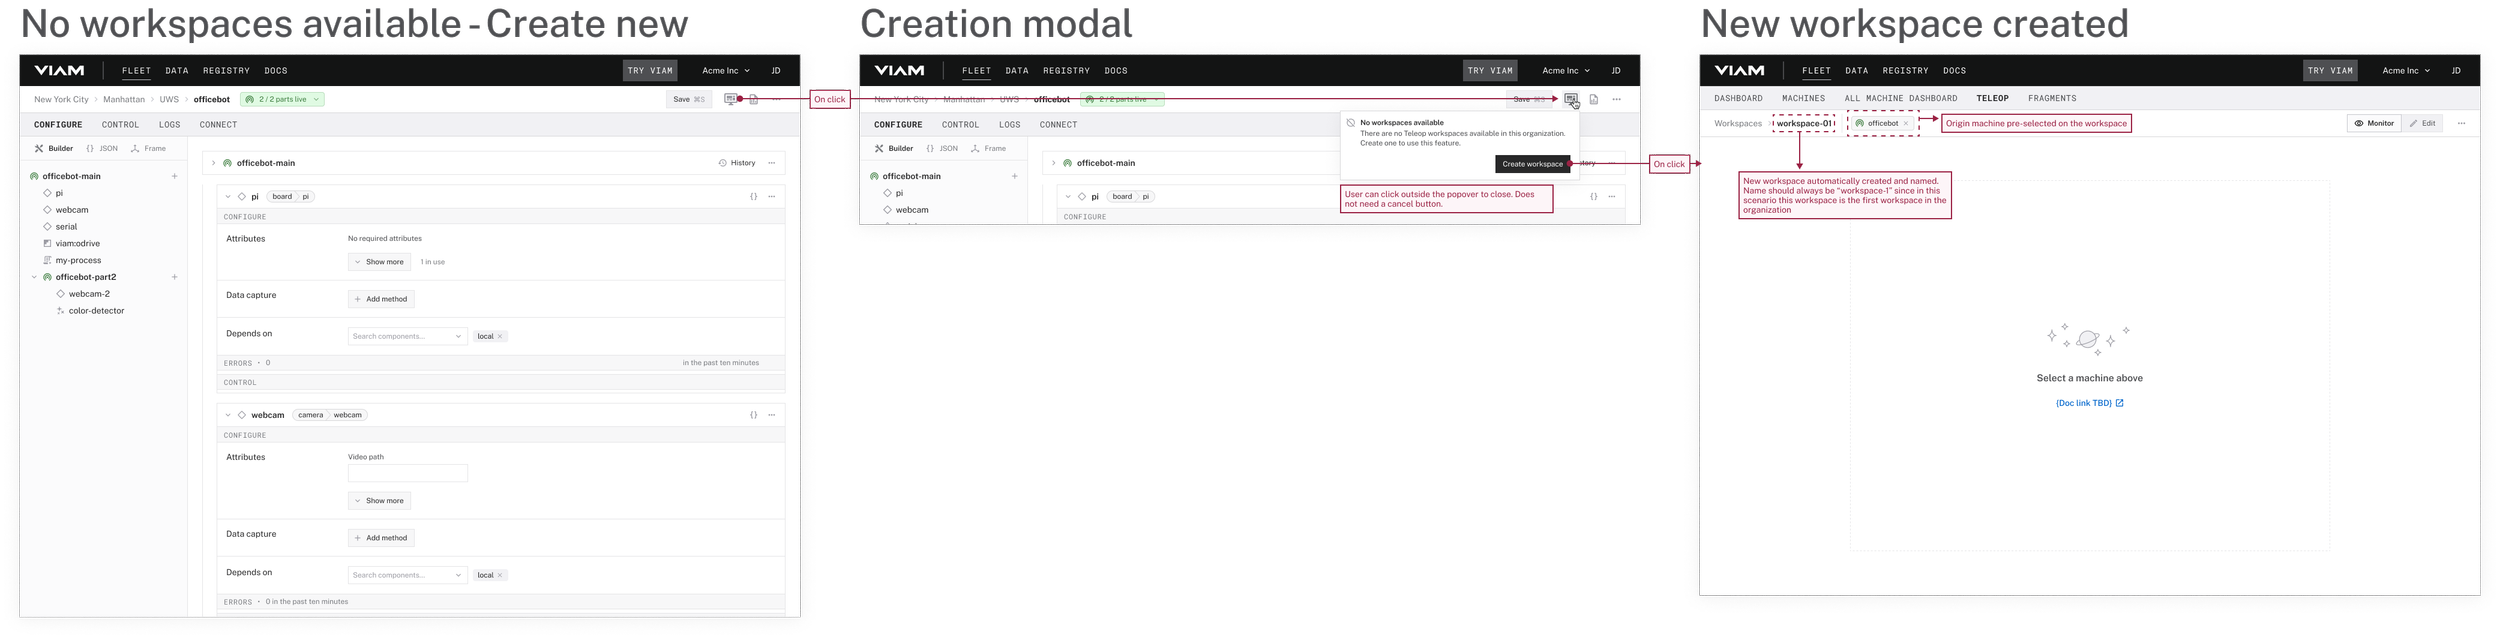
The testing also surfaced the need to create a new workspace from an existing machine. To allow easy interoperability between a live machine and a teleop workspace we wanted to add functionality to allow users to easily switch views without needing to go through high-level navigation to get there.
Key Functionality
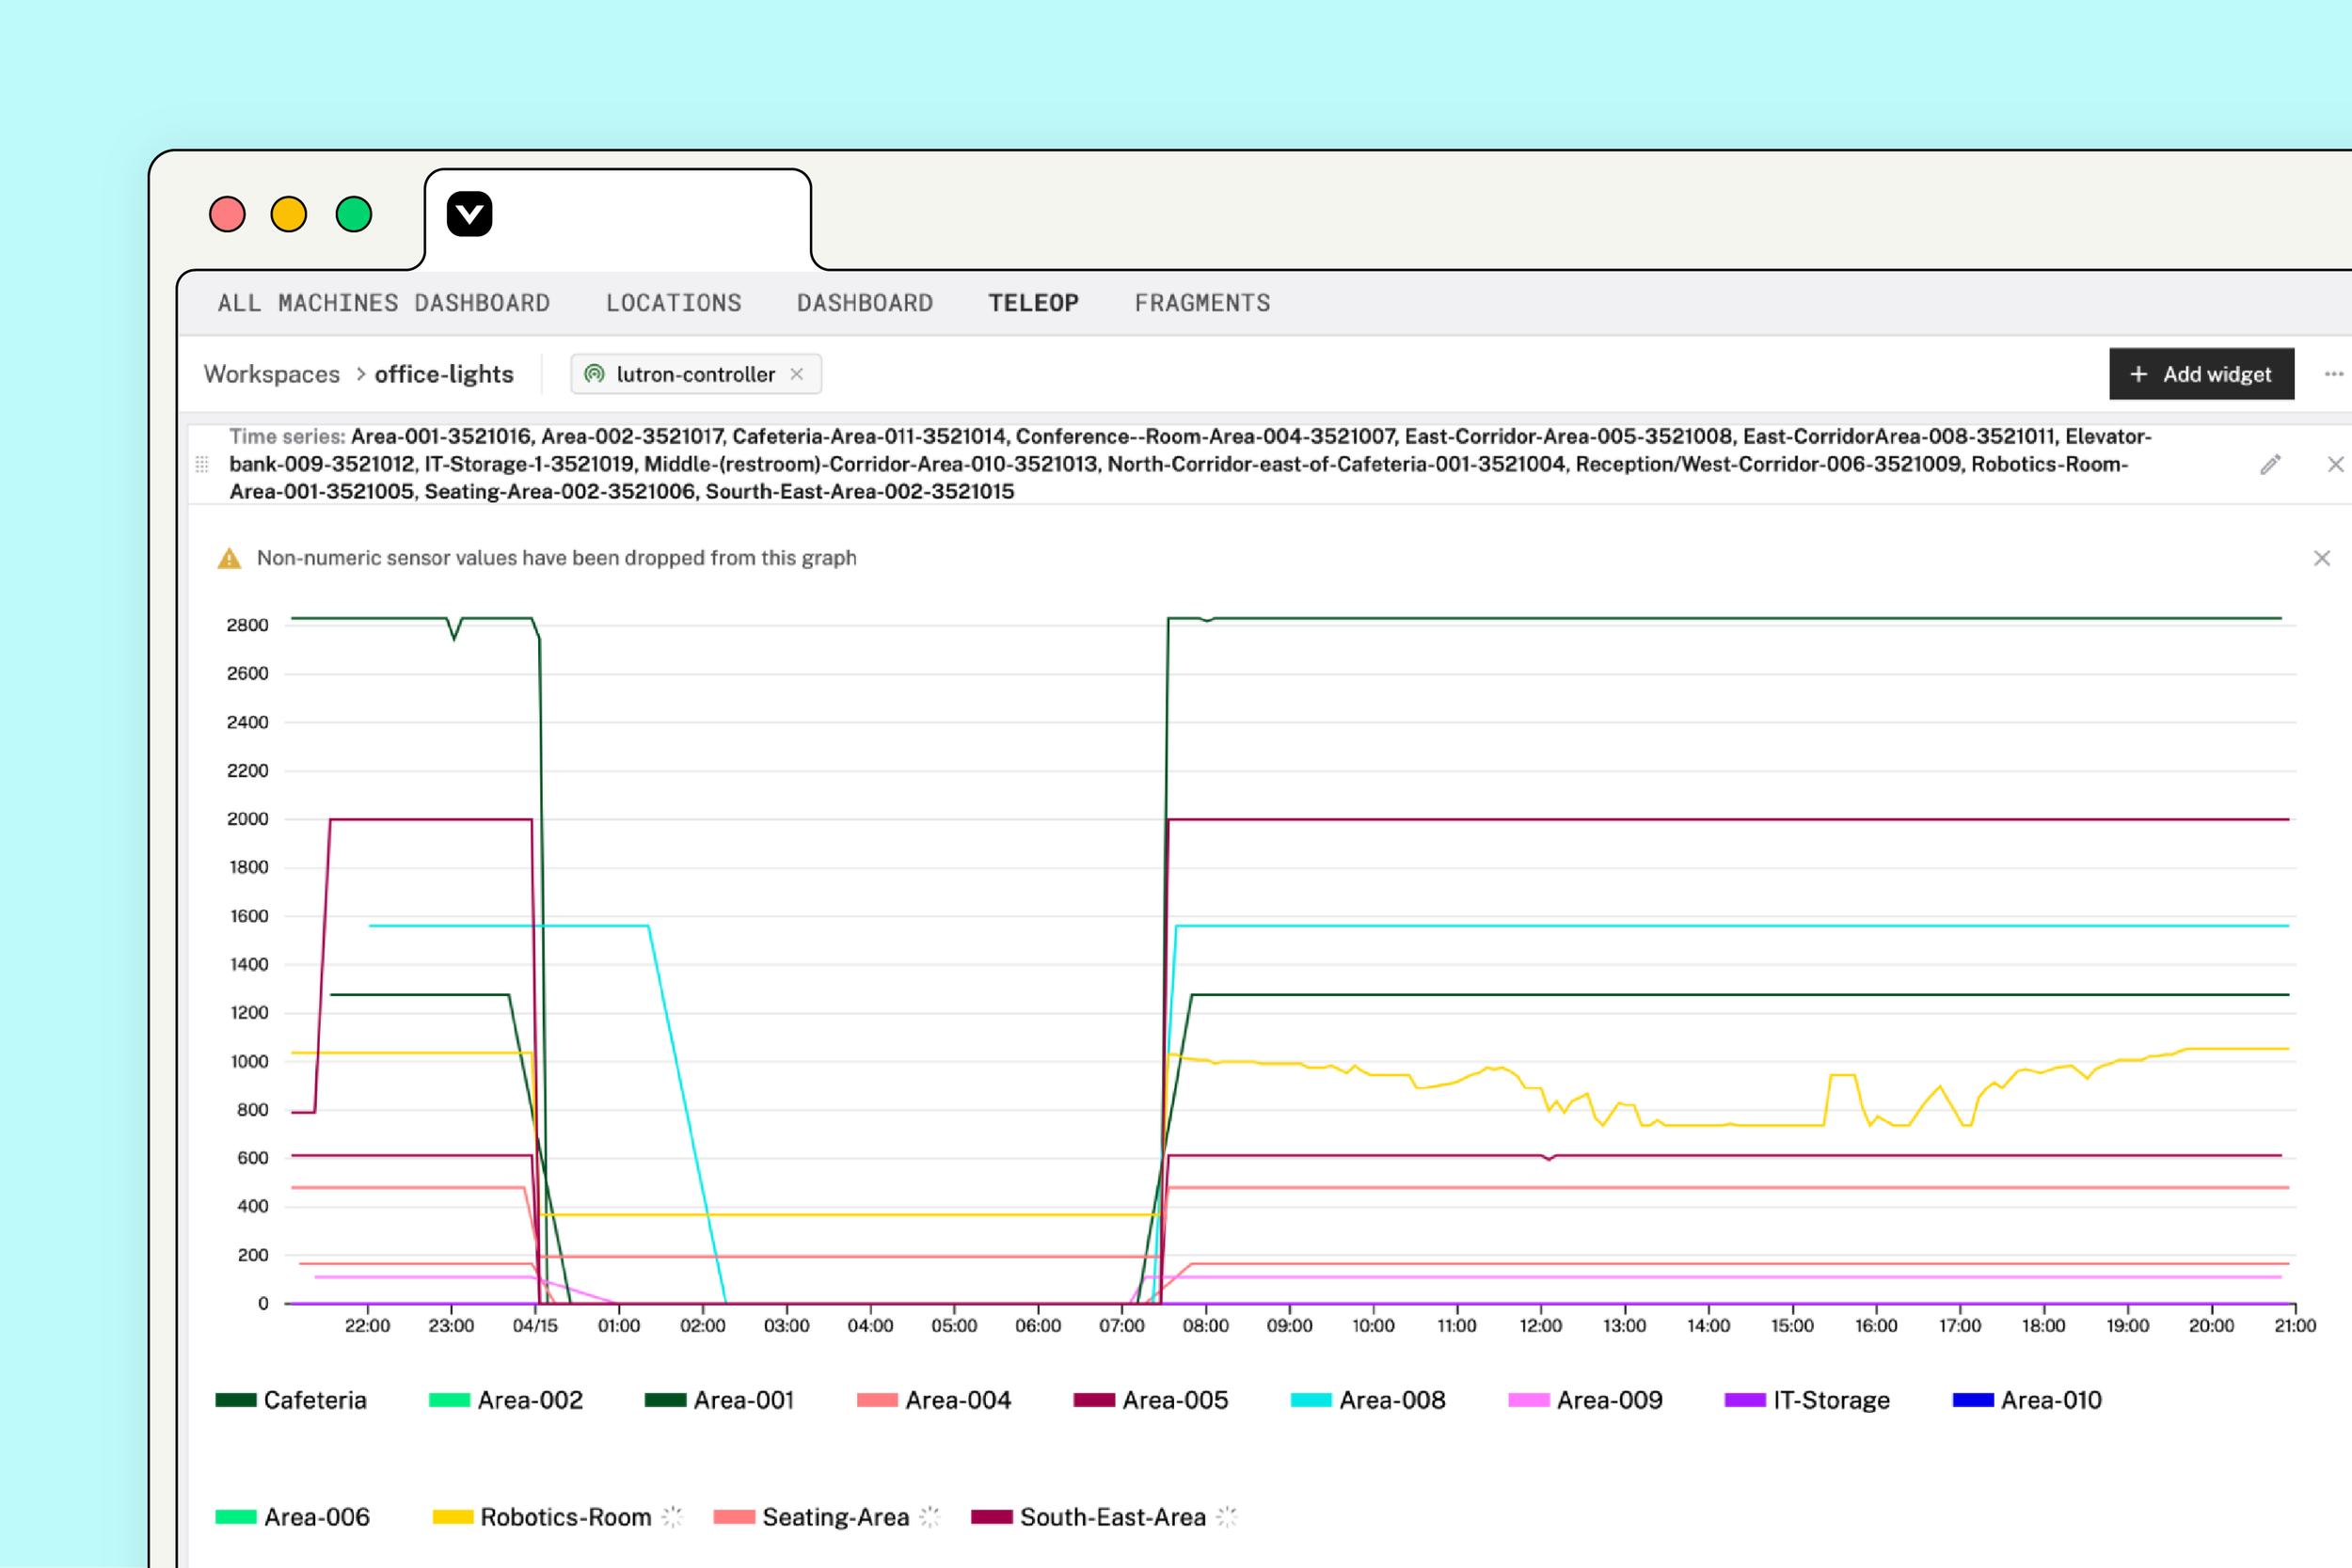
Adding Widgets
Centralized view of visual, spatial, and diagnostic sensor data for live machine monitoring.
Adding a machine
Centralized view of visual, spatial, and diagnostic sensor data for live machine monitoring.
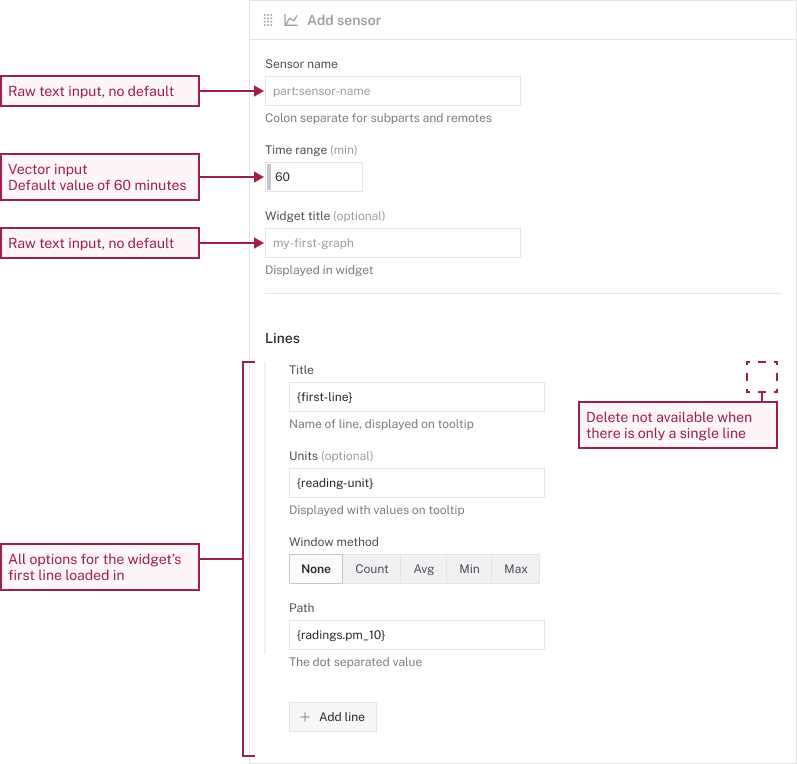
Widget configuration
Modular setup for selecting, arranging, and customizing live data and control widgets across the dashboard.
Machine monitoring
Centralized view of visual, spatial, and diagnostic sensor data for live machine monitoring.
Outcomes
📝 $2.75Min signed contracts from early enterprise users
🤝 6partnerships
🛠️ Improved uptime and operational safety for fleet operators
Reflections
Areas for Improvement
⏳ Overall time to develop and launch could be reduced.
🚀 A phased launch approach would have accelerated delivery and feedback loops.
🎨 Simultaneous development of the design system slowed product velocity.
⚖️ Balancing organization-wide demands with deep project work proved challenging.
What went well
🛒 Increased customer conversion through clearer telemetry visibility.
🤝 Reduced support effort for our solutions engineering team.
🧠 Improved developer comfort and ease-of-use in app.
⚡ Faster task completion times for operators and engineers.